In Ruchir Shama’s opinion piece last month, he wrote about recent efforts to move “beyond…
GNHUSA Releases First North Carolina GPI Study
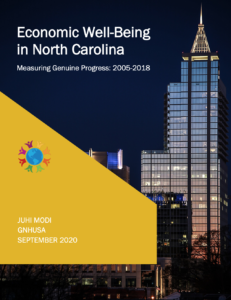
This morning, Gross National Happiness USA released a new report on North Carolina’s economic well-being as measured by the Genuine Progress Indicator (GPI), a comprehensive metric that accounts for environmental and social factors neglected by Gross Domestic Product (GDP).
This study measures North Carolina’s economy from 2005 to 2018. Over these 14 years, North Carolina’s GPI grew about 35%, primarily driven by economic indicators. Some positive trends that drove the growth from 2005 to 2018 in GPI include:
- Personal consumption per capita was $3,180 higher in 2018 than in 2005.
- Air pollution declined with decreases in emissions of all five major pollutants. Specifically, sulfur dioxide emissions dropped 95% and nitrogen oxide by 61%.
- The number of people with a bachelor’s degree or higher increased by 65% from 2005 to 2018.
- North Carolinians volunteered for 27.8 million more hours in 2018 than in 2005.
Although the GPI per capita grew, it was on average only half as large as the GDP per capita due to the costs of various environmental hazards and social factors. Some primary forces behind the difference in North Carolina’s GPI and GDP are the following:
- The income inequality cost for each person increased by nearly $2,000 from 2005 to 2018.
- 3.79 million more tons of solid waste were disposed of in 2018 than in 2005.
- The cost of lost leisure time increased as the average worker spent 21 more hours at work and had 10 fewer hours of leisure time in 2018 than in 2005.
- Water pollution costs rose with 1,670 more square miles of water degraded in 2018 than in 2005.
This study was conducted by Juhi Modi, GNHUSA intern and an undergraduate student at the University of North Carolina at Chapel Hill, in partnership with Gross National Happiness USA.
You can read the full report below.

