In Ruchir Shama’s opinion piece last month, he wrote about recent efforts to move “beyond…
US Happiness Trends, Top 40 Radio and Sentiment Analysis
There I was, just sitting in my apartment, daydreaming about what the US will be like after we replace Gross Domestic Product with Genuine Progress Indicator as our primary way to measure economic progress and happiness. All of the sudden the next song on my oldies playlist comes on and I hear the great 20th century theorist of subjective well being, John Lennon’s voice.
He sang out “Happiness is a waaaaaarm gun.”
Interesting theory, John. Seems unlikely.
While I disagree with Mr. Lennon’s hot take I will give him partial credit for making his case via song (a very good song at that). The partial credit is awarded because music is happiness, or at least a source of it.
Let’s take a look at some interesting benefits of music to understand why I think music is a significant source of happiness.
- One fascinating experimental study in the Journal of Positive Psychology found that upbeat music has been linked to improved mood.
- One study found that music increased empathy in elementary school children.
- Another study found that babies as young as five months could identify and respond to the technical differences between happy and sad music – suggesting music appreciation is hardwired in us.
- Amazingly, another study found that music can increase cardiovascular endurance by upto 15%.
- Finally, one study even found that audience member’s brain waves even synchronize at live concerts.
So it’s pretty clear that music can make us healthy, connected and happy but what may be even more interesting is that studies have shown that music can serve as a powerful communication medium to express what one is already feeling.
If this is true, then might it be the case that on a national level our collective music choice is reflecting the collective mood?
What is the state of the collective mood?
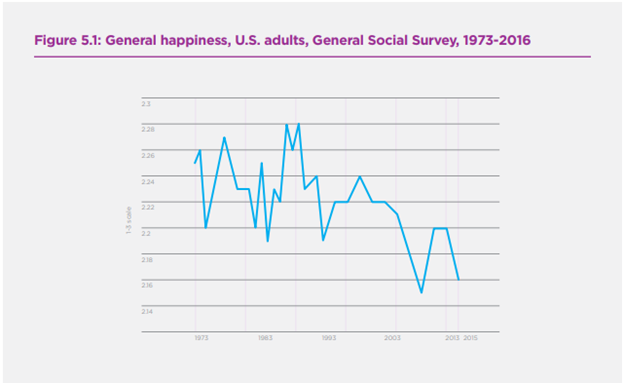
According to the General Social Survey (GSS), general happiness in US adults has been on the decline in the past decade. The 2019 World Happiness Report explains the issue this way:
“The years since 2010 have not been good ones for happiness and well-being among Americans. Even as the United States economy improved after the end of the Great Recession in 2009, happiness among adults did not rebound to the higher levels of the 1990s, continuing a slow decline ongoing since at least 2000 in the General Social Survey (Twenge et al., 2016; also see Figure 5.1). Happiness was measured with the question, “Taken all together, how would you say things are these days—would you say that you are very happy, pretty happy, or not too happy?” with the response choices coded 1, 2, or 3. Happiness and life satisfaction among United States adolescents, which increased between 1991 and 2011, suddenly declined after 2012 (Twenge et al., 2018a; see Figure 5.2). Thus, by 2016-17, both adults and adolescents were reporting significantly less happiness than they had in the 2000s.”
With the state of our collective mood established and the prediction from the research in mind we should expect that our collective music selection has become more negative over time.
Now we just need to get our hands on some data.
How we answered the question:
To answer this we decided to conduct a study which looked at all of the songs which reached number one on the Billboard Mainstream Top 40 list since GNHUSA’s founding in 2009. This included a total of 205 songs. To conduct our study we enlisted the help of a sentiment analysis package called Azure Machine Learning. This tool works by assigning ~2500 words in the English language an emotional valence score between 0 and 1. For instance, a death metal song would likely get an emotional valence score of 0.00001 while Pharrell’s chart topping song “Happy” received a score of .986063.
Note: For the sake of time and simplicity, only the chorus of each song was analyzed to determine the emotional valence score.
Findings:
The short answer is a resounding and unfortunate “yes!” The emotional valence of hit songs is reflective of the trend towards declining US happiness.
Looking at the distribution of positive vs negatively charged songs we can see that negatively charged has the commanding upperhand among top rated pop songs since 2009.
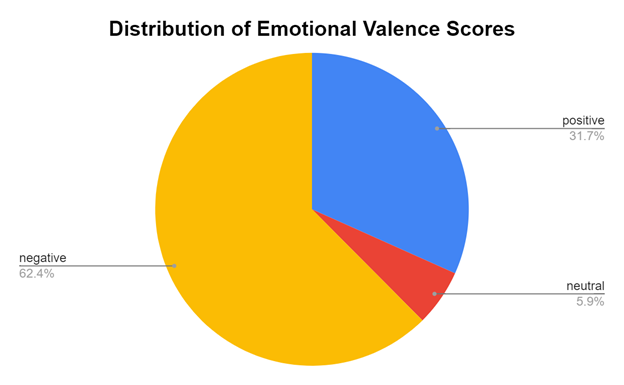
The classification of scores came built into the sentiment analysis tool and is as follows: a score between 0 and 0.49999 was negative, any score between 0.45 and 0.64999 was given a neutral emotional valence and a score of between and 0.65 and 1.0 was tallied as positive emotional valence.
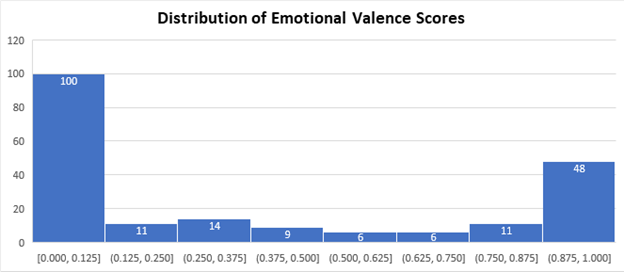
The graph below shows the polarity of emotional valence of songs into stark relief. Nearly 49 percent of all songs analyzed had an emotional valence between 0 and 0.15. Just over 23 percent fell in the bin of 0.85 – 1.0 emotional valence. The extremely negatively charged songs and the extremely positively charged songs together account for nearly three quarters of all of the songs in this analysis.
So we have an idea of the general distribution but what about the average emotional valence over time?

As seen in the above graph there is a notable downward trend in the average emotional valence of number one songs since 2009. The downward trend could be caused by the same reasons as the decline in general happiness among US adults as reported on the General Social Survey. Reasons may include political unrest, widening income and wealth inequality and increased screen time.
The reasons for a declining average emotional valence of hit songs could also be more benign. Possible reasons may include a higher frequency of four letter words, an increased use of double negatives in lyrics or an increase in lyrics containing positively intended words that the machine learning model does not recognize.
In short, the decline may be due to the limitations of the model.
We can understand the limitations of our analysis further by taking a look at a list of the 10 most positive and negative songs that were found during our analysis.
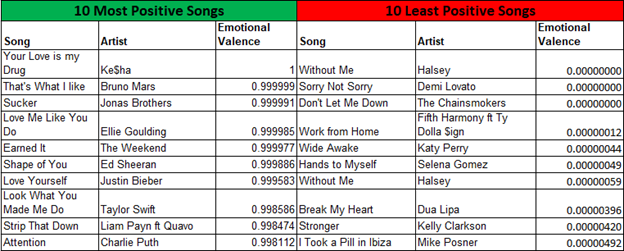
As you can see, Selena Gomez’s song “Hands to Myself” is the 6th most negatively charged song on this list but anyone who listens to the song can hear that it is actually a catchy dance record that elicits a positive affect. Selena’s repetitive use of the word “myself” and “can’t” earned the song such a low rating on the emotional valence meter.
After doing all of the work to find out that music choice is to a degree reflecting our declining national happiness we wanted to dig deeper and see if things like seasonality, number of weeks at number one or whether or not the song was a collaboration mattered.
Wouldn’t it be very poetic if we found that songs featuring collaborations were more positively charged? That would make for a great metaphor. Alas, we found that having collaborators wasn’t at all correlated with emotional valence.
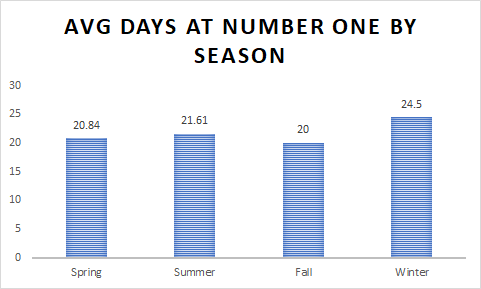
But we did find that there was an effect that the season of the year had on music selection. During winter, songs stayed at number one an average of 4 days longer. Reading into this finding, one must ask if this is a manifestation of the winter time happiness thief: Seasonal Affective Disorder? The disorder is documented to cause social withdrawal and loss of interest in previously enjoyed activities – both critical elements in finding new music.
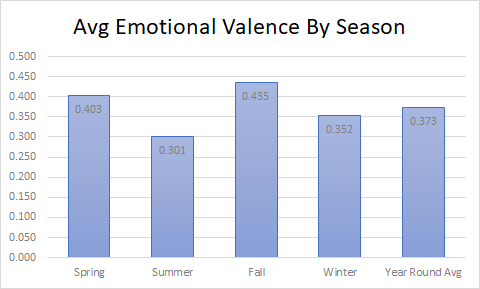
We also found that the season of the year predicts emotional valence. In general, summer and winter had the most negatively charged lyrics.
Summer’s lyrics seemed to score low due to negative swear words while maintaining an upbeat tempo – in other words, your subjective experience of the song is likely to be more positive. Conversely, winter songs were more likely to have dark themes and were slower tempo making them more likely to be experienced subjectively as negatively charged.
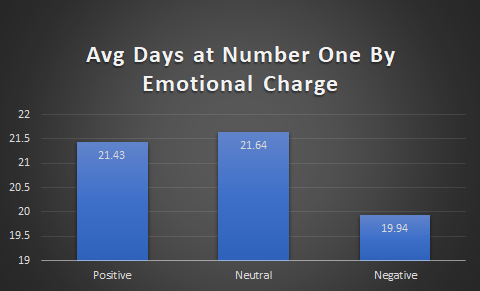
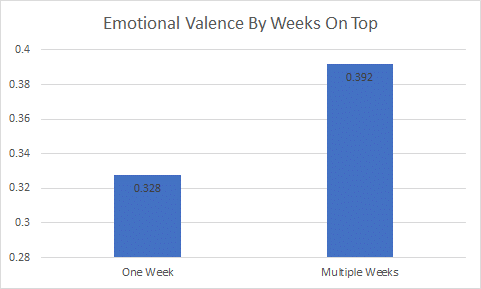
Finally, our last two graphs look at how the emotional charge correlates with the amount of time a given song spends at number one. Songs from the “positive” category spent 1.5 more days on top than songs in the negative category.
Our analysis suggests that positively charged number one songs are slightly more popular than negatively charged number one songs. Songs at number one for multiple weeks have a noticeably more positive emotional valence than songs which spent just one week at number one.
What’s it all mean?
As noted, sentiment analysis is far from perfect but it does appear that the emotional valence of top mainstream songs is reflecting the national mood and becoming more negative. Our forecasting model predicts that death metal will be played at dance clubs as the popular genre of choice by 2030 if we don’t act now! Just kidding.
The excellent news that we’ll leave you with is that music isn’t just a reflection of our mood, it can also be used to change our mood. This information can be put to good use by the policymaker looking for ways to increase population level subjective well being as well as the individual looking for a mental health boost.
Challenge for policymakers: I challenge you to seriously consider music as you design policies to increase population level subjective well being eg. music education funding.
Bonus challenge for policymakers: Visit New Orleans and observe their music culture. Bring relevant ideas back home to benefit your urban design policies and develop new civic indicators such as Sidewalk Drum Circles per capita (only halfway kidding here).
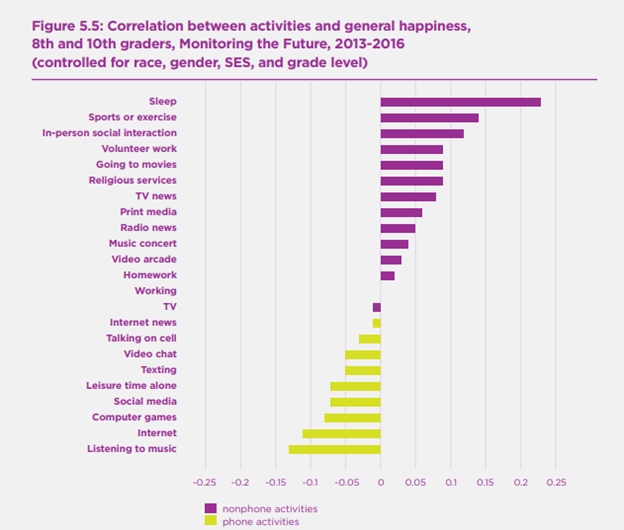
Challenge for individuals: Individuals, for your part I challenge you to start a drum circle or intentionally ride in an elevator and dance to the music. But whatever you do don’t listen to music on your phone with earbuds in place of going to a live concert – according to the World Happiness Report, this was found to be negatively correlated with happiness.
Sorry to be a bummer.
Back to our friend, John Lennon, how might we respond to him? I’d tell him, “happiness may not be a warm gun but music on the other hand, is a warm lead in finding our collective happiness.”
But he already knew that.